plot_distance_distribution: Tool to represent the distance between adjacent CNVs
- plot_distance_distribution.main(args)[source]
Plots the distribution of the distance separating CNVs.
This tool is essential to observe fragmentation, which can occur if an algorithm does not verify if the region between calls is actually part of the genotyped CNV.
In this case, the CNVs will be separated by a very small genomic distance on the CNV scale. It is recommended that a threshold be selected and that a merge of the CNVs separated by a distance under this threshold be merged.
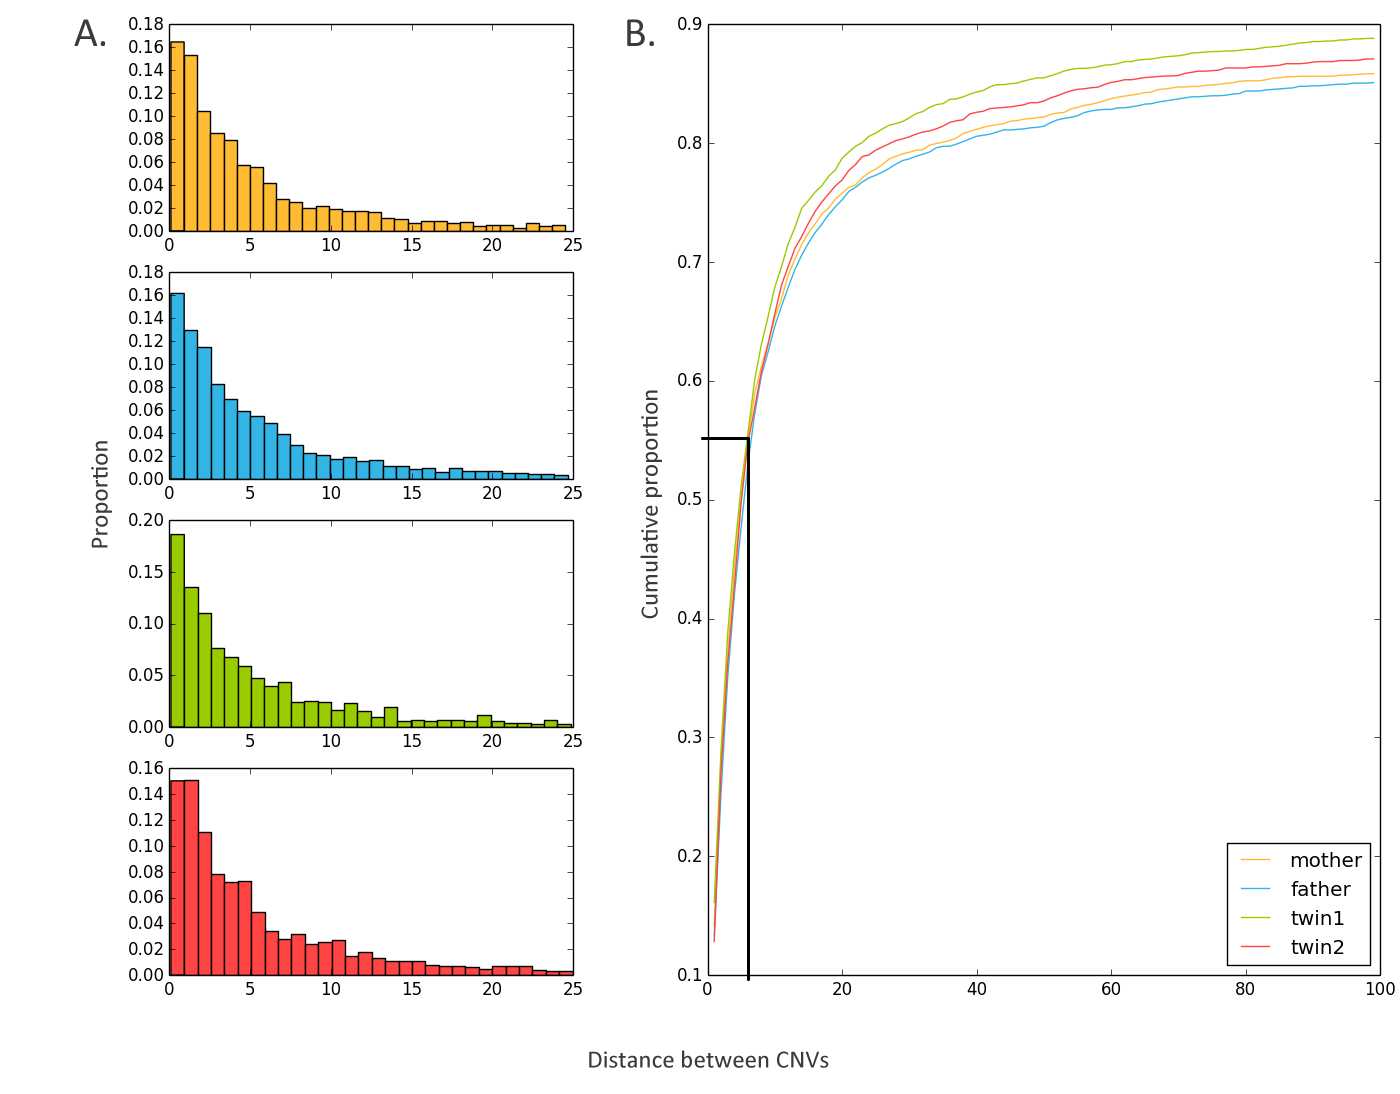
Figure 1. Sample graphs illustrating a fragmentation problem. The cumulative histogram shows that 55% of CNVs are separated by less than 5 kilobases, which is a small distance on the CNV scale.