plot_size_doc_scatter: Tool to plot the depth of coverage information as a function of CNV size
- plot_size_doc_scatter.main(args)[source]
- Plots the depth of coverage as a function of the size for both gains and
- losses.
This can be useful in depth of coverage algorithms to insure that calls are concordant with the depth of coverage ratio and to identify systematic biais in gains and losses with respect to CNV size.
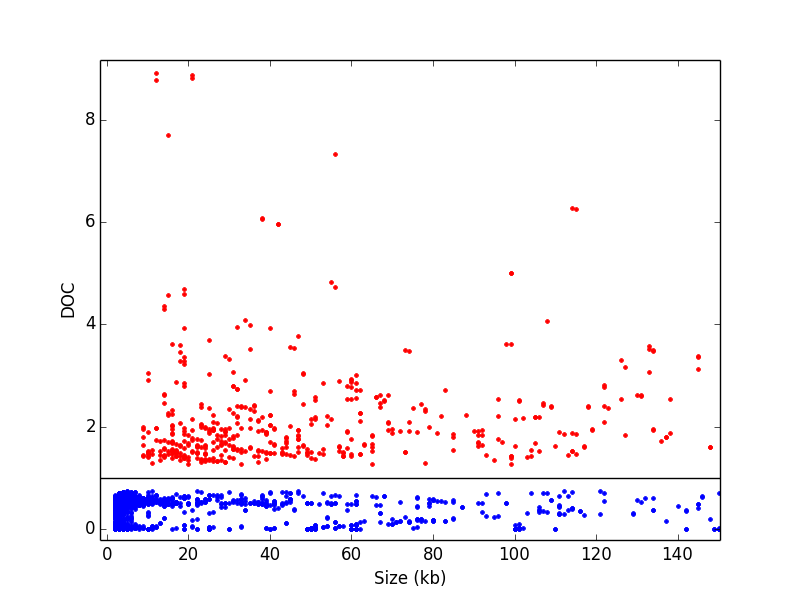
Figure 1. Example illustrating typical case of depth of coverage based calls where DOC < 1 implies a deletion and DOC > 1 implies a gain. Here, we can see a slight biais towards larger CNVs for gains. Legend: Red is for gains and blue for deletions.