venn: Tools to create Venn diagrams.
This module generates a svg file containing a 5 way venn diagram. It was used to generate the diagrams representing the overlap between the different methods. You can see a sample diagram in Figure 1.
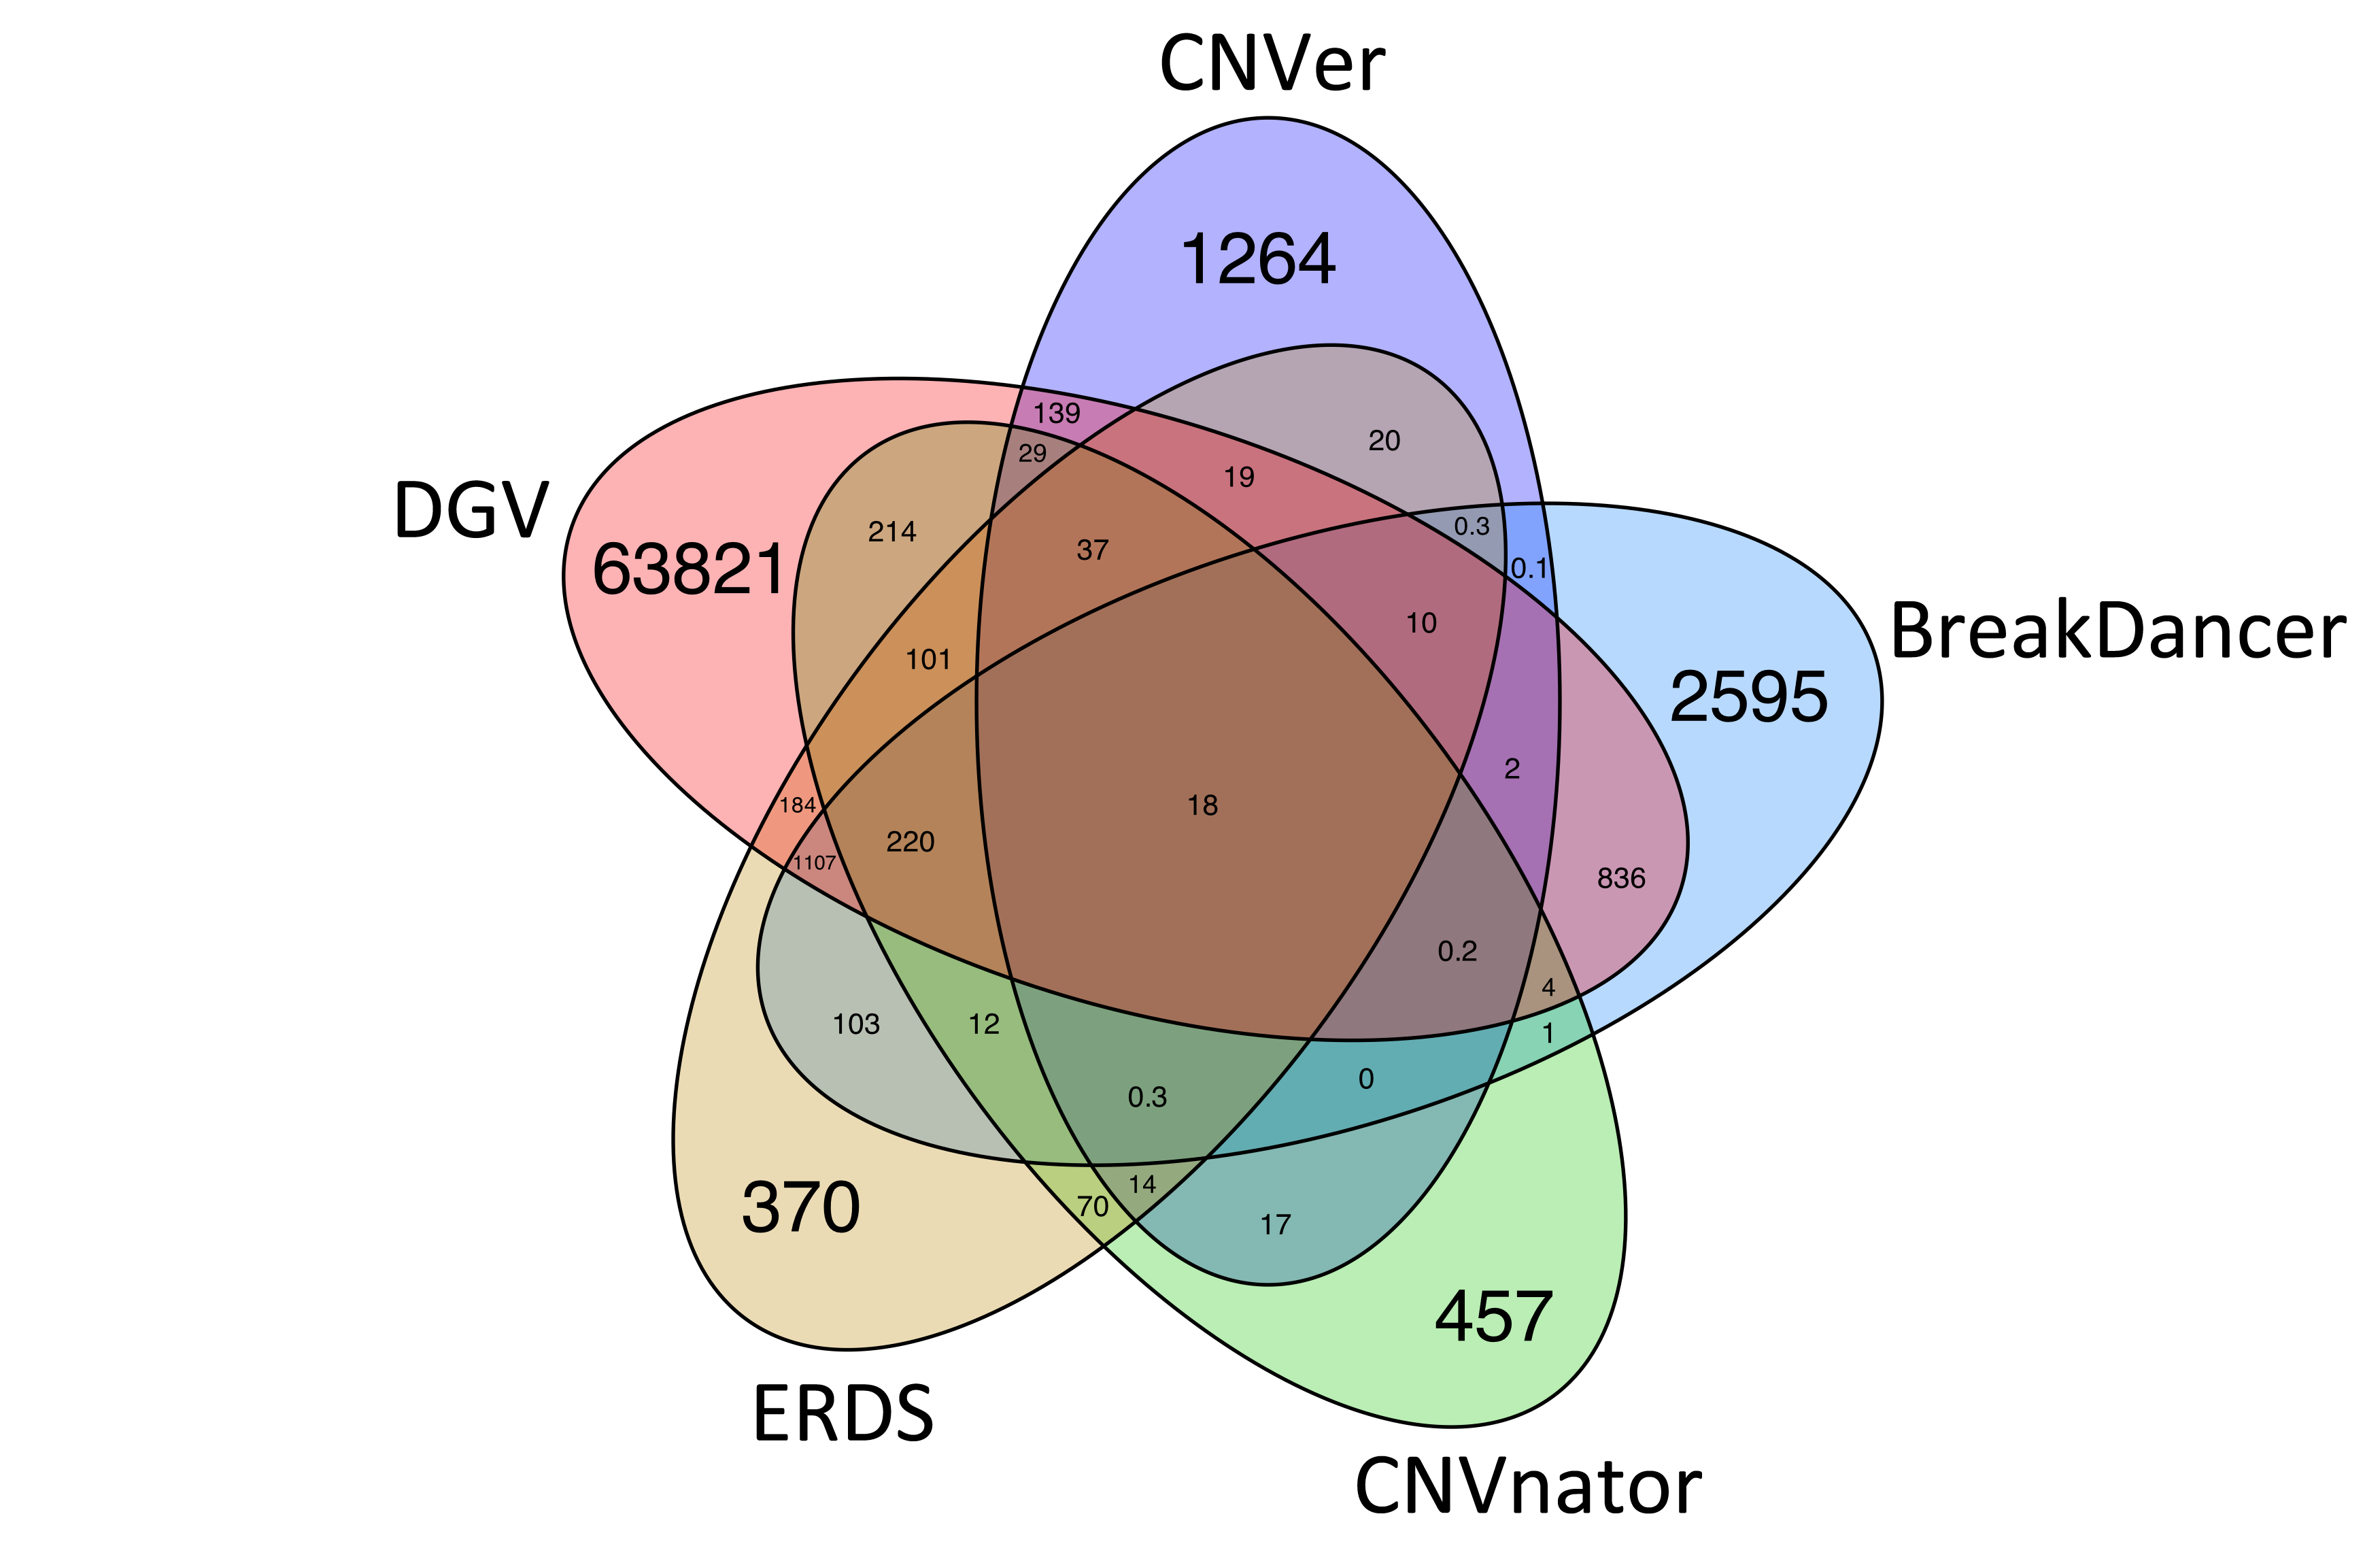
Figure 1. A Venn diagram generated by the different methods from the venn module. The labels were modified using image processing software and the file was rasterized and saved to the png format.
- venn.create_label(x, y, label, dy='0.7ex', font_size=None)[source]
Creates the html tag to display text on the Venn diagram.
Parameters: - x (str) – The x coordinate.
- y (str) – The y coordinate.
- label (str) – The text to display.
- dy (str) – The y axis offset (default: 0.7ex).
- font_size (str) – The font size for the label.
Returns: A string representing the html for this label.
Return type: str
- venn.create_venn_from_dict(d, file_name='venn_diagram.svg')[source]
Creates a Venn diagram from a dictionary of counts for the different sets.
Parameters: - d (dict) – The dictionary, as described below.
- file_name (str) – The output svg filename.
Takes a dictionary containing elements of the power set of {a,b,c,d,e} as keys and the count for every category as values.
- venn.position_based_venn(cnv_lists, threshold)[source]
Creates the Venn diagram from the lists of CNVs for the different methods.
Parameters: - cnv_lists (list) – The list containing the CNVs from the different methods. (i.e. a 2D list where li[0] is a list of CNVs from method 0, li[1] is a list of CNVs from method 1, etc.)
- threshold (float) – The reciprocal overlap threshold to consider CNVs to be identical (0 < threshold <= 1).
Returns: The counts dictionary that can be used by the create_venn_from_dict() method.
Return type: dict
Since the equivalence between two CNVs is hard to define, we used the method described below to generate the counts for every method. CNVs from the same algorithm that are linked through chaining with other CNVs are discarded from the Venn.
e.g.
1.     =======    ========
2.      =========
3.          ========
4.             ==========
In the above example, the two distinct CNVs from algorithm one are in the same cluster when considering R.O. > 70%. Thus, we will discard the second CNV from algorithm 1 from the analysis, as incrementing the count would affect the absolute counts from the other algorithms. We will remember the ignored CNVs.